
About Me
Hi! I'm Swapnil Patil, and I'm a Data Analyst👋🏻
I focus on creating dashboards and reports for data-forward companies.
I'm laser-focused on creating business insights that drive decision making and I help companies ⚡️automate⚡️ reports that connect to all their data.
With hands-on experience in both reporting and analytics, I help organisations unlock the power of their data.
Skills

Excel | Tableau | Power BI | Power Automate | SQL | Python
Featured Projects
Microsoft Excel
Coffee Sales Dashboard
Uncover the rich flavors of data with Coffee Sales Dashboard—brewing up fresh insights to energize sales strategies and stir customer engagement.


Python | Tableau
London Bike Ride Analysis
Cycle through insights with London Bike Ride Analysis—exploring how weather patterns and urban pulse shape cycling trends!
SQL | Power BI
Internet Sales Analysis
Explore internet sales data with Power BI Dashboard-turn static data into dynamic decisions that drive business growth.


Python | Apache Spark
NYC Rideshare Analysis
Navigate the streets of data with NYC Ride Share Analysis—to uncover the busiest routes and optimal times for Uber & Lyft, boosting earnings and streamlining operations.
Python
E-Commerce Customer Network Analysis
Unpack e-commerce relationships with this analysis—using Python and NetworkX to uncover customer-product patterns and trends.


Python
Sentiment Analysis From Tweets
Transform tweets into trends with SVM (Support Vector Machine) classification—classifying thousands of tweets to map public opinion.
Professional Certifications
Data Analytics and Visualization Job Simulation
Accenture North America - Issued July 2024

Data Analytics Job Simulation
Quantium - Issued July 2024

MySQL For Data Analytics And Business Intelligence
365 Careers - Issued Sept 2022

Complete Data Science Bootcamp
365 Careers - Issued Jan 2022
Coffee sales dashboard
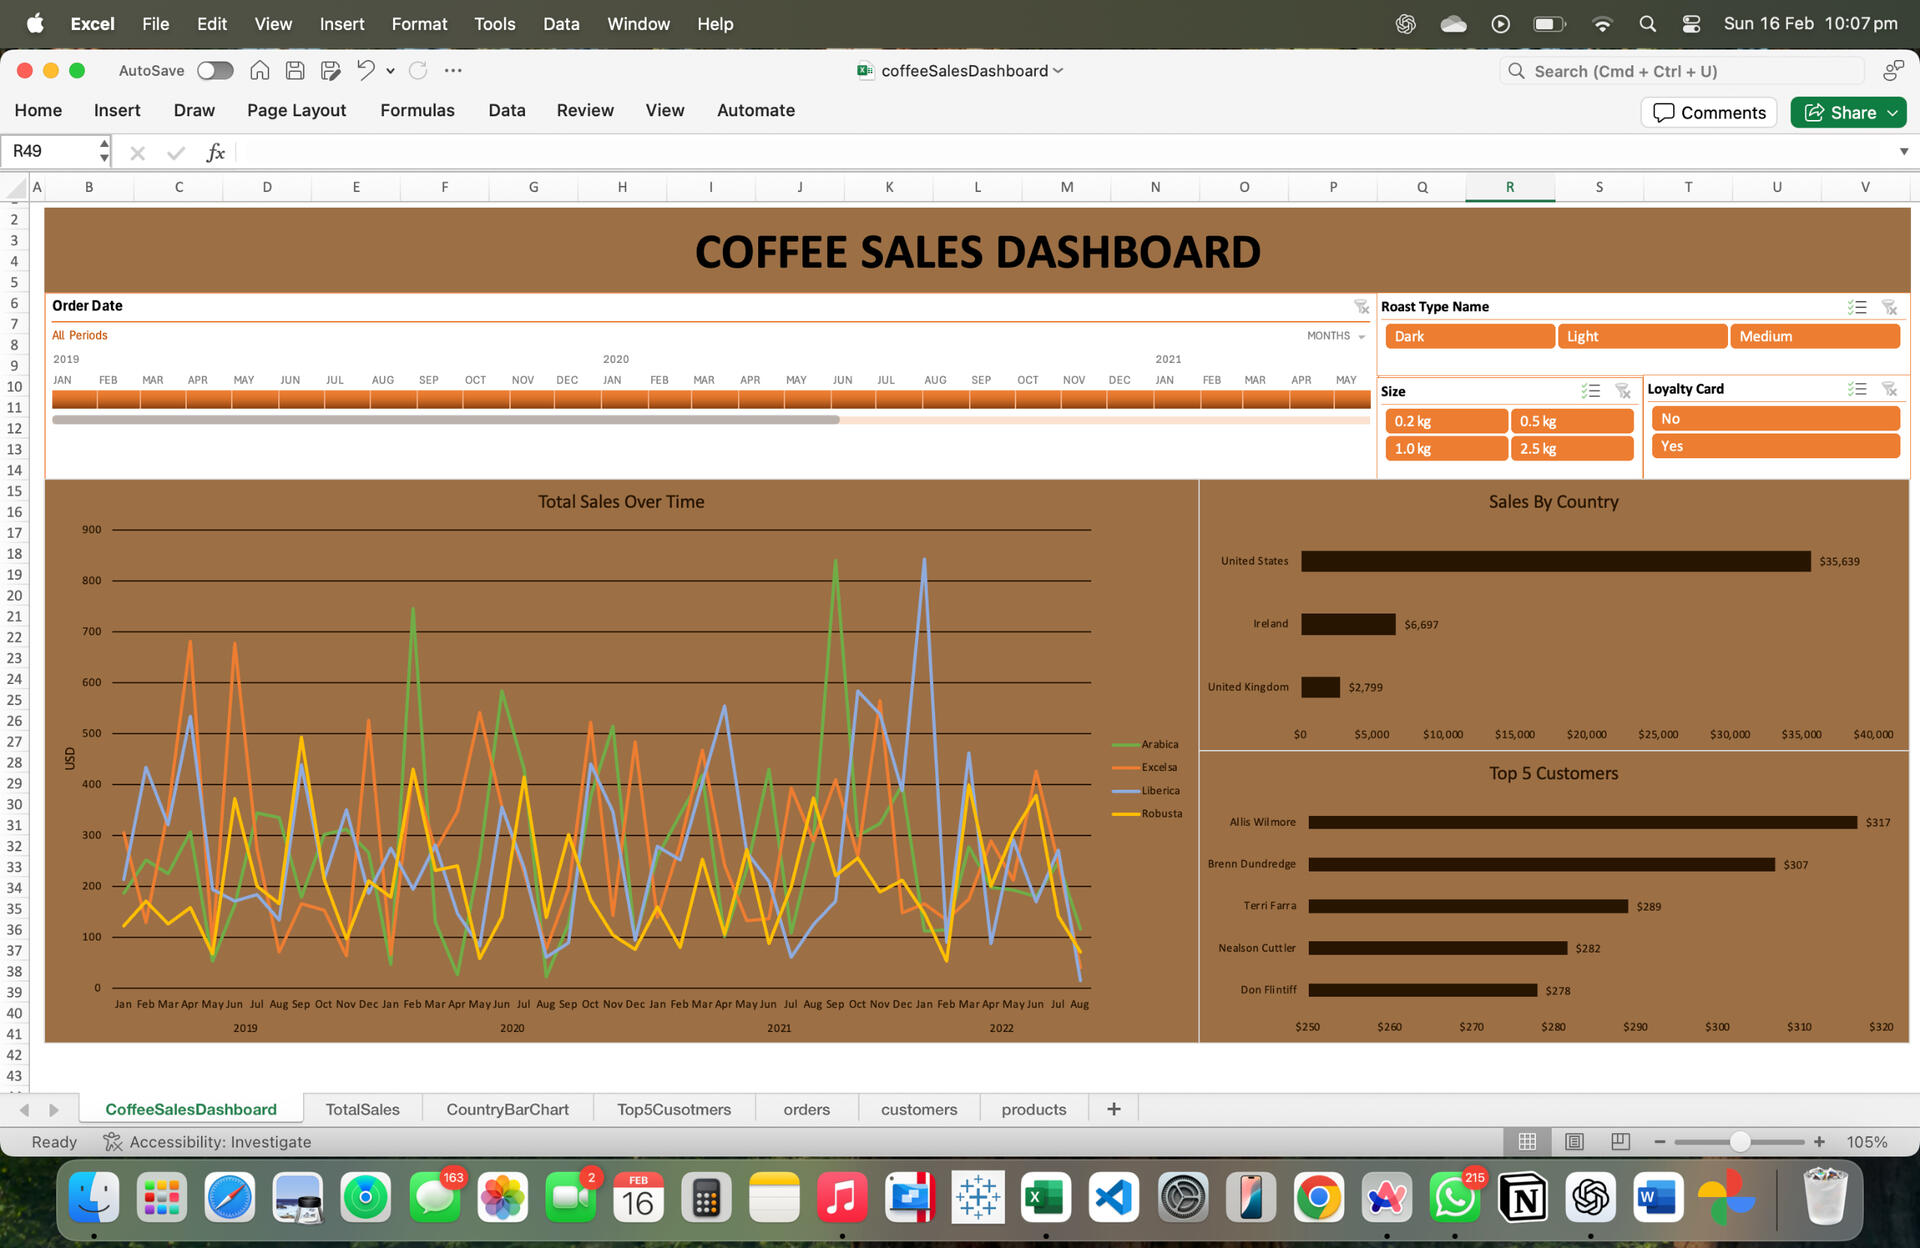
What factors influence global coffee sales? I developed a comprehensive Coffee Sales Dashboard using Microsoft Excel to dive into the intricacies of coffee sales across different countries, coffee types, and customer demographics. This analysis helps understand consumer behavior and optimize sales tactics.Here are the questions I was interested in answering:
• Which coffee types are most popular in different regions?
• How do sales trends vary by country and customer type?
• What are the peak sales periods for coffee?
• Which customers are most loyal based on repeat purchases and loyalty cards?
• How does the size of coffee packages affect sales volume?I took the following steps to create my dashboard:
• Gathered and cleaned coffee sales data from multiple sources into Excel.
• Utilized pivot tables and dynamic charts to summarize and analyze the data.
• Integrated XLOOKUP and INDEX MATCH to refine data retrieval across tables.
• Implemented interactive elements like slicers and timelines to allow users to filter data dynamically.
• Enhanced visual appeal and user experience by customizing chart styles and dashboard layout.Here are my key takeaways:
• Arabica and Robusta are the most preferred coffee types.
• The United States, Ireland, and the UK are top markets, showing distinct consumer preferences.
• Sales peak during late mornings and early afternoons.
• Customers with loyalty cards tend to make more frequent purchases.
• Larger package sizes are more popular among repeat customers.
London Bike Ride Analysis

This project leverages advanced data visualization tools to analyze London’s bike sharing data, focusing on the relationship between environmental factors and cycling patterns.Questions of Interest:
• How does weather affect the frequency of bike rides?
• What are the peak times for bike rides throughout the day and year?
• How do temperature and wind speed impact bike usage?Steps Taken for Analysis:
1. Data Collection: Data was downloaded from Kaggle using Python.
2. Data Preparation: The data was cleaned and prepared with Python and Pandas, setting the stage for effective analysis.
3. Visualization: I constructed an interactive Tableau dashboard that allows users to visually explore data through dynamic charts and filters.Dashboard Utility:
• Interactive Exploration: Users can manipulate data views and gain insights by interacting with the dashboard, adjusting variables like time and environmental conditions.
• Customizable Analysis: The dashboard’s flexible design lets users tailor their analytical focus, adapting to different questions and data exploration needs.
• Informed Decision-Making: Provides stakeholders with a powerful tool to make data-driven decisions, enhancing operational strategies and service delivery.

Internet Sales Analysis

What drives internet sales effectiveness? In response to a request from Steven, the sales manager, I developed a Power BI dashboard to transform static sales reports into a dynamic, interactive exploration tool. This project aims to improve the understanding of sales trends and customer behaviors by leveraging advanced data visualization technologies.Questions of Interest
• How does sales performance track against budget throughout the year?
• Which products and customer locations contribute most to sales?
• How do customer demographics influence buying patterns?Steps Taken for Analysis
• Initial Request and Business Demand Overview: After receiving Steven’s detailed requirements mail, I created a strategic document outlining key business questions and data needs.
• Data Preparation: Managed and prepared data using SQL Server, ensuring a clean, analysis-ready dataset was available.
• Dashboard Development: Built three Power BI dashboards:
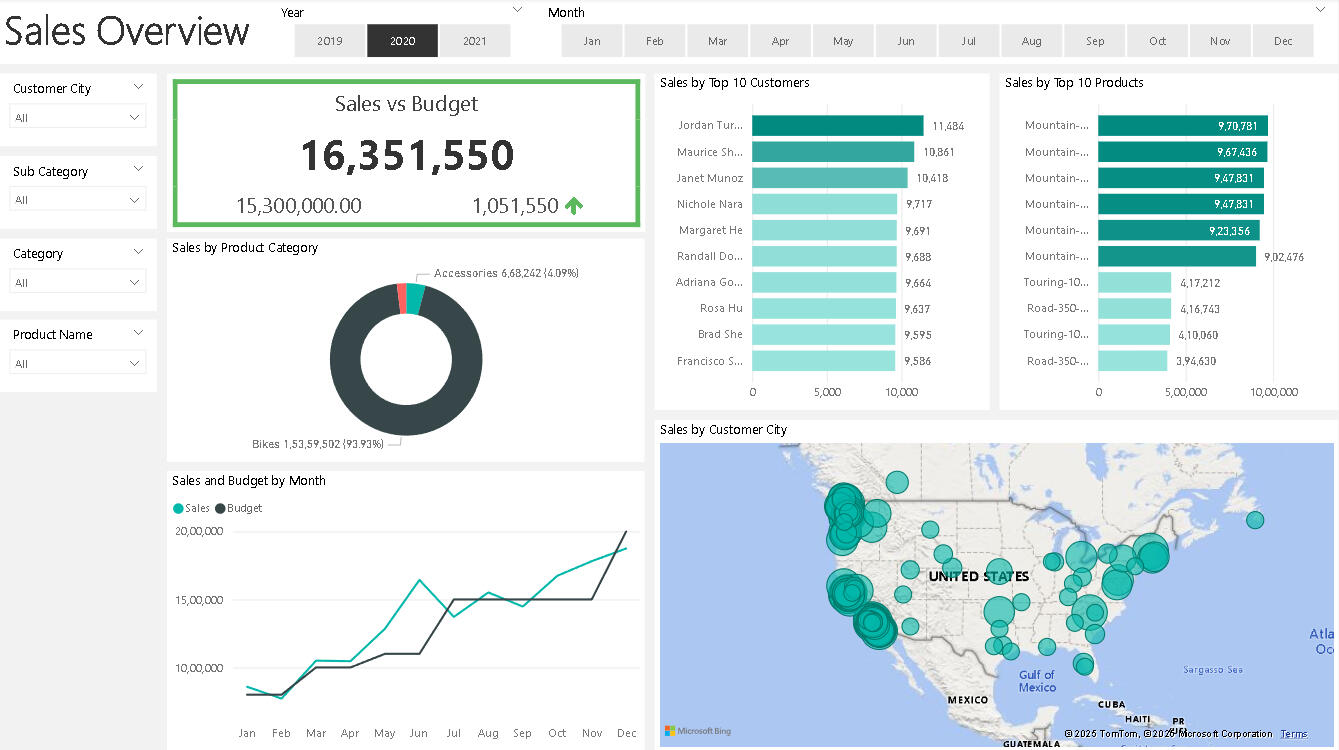
1. Sales Overview Dashboard: Tracks sales against budget and categorizes data by product and customer location.
2. Customer Details Dashboard: Analyzes sales by customer demographics and geographic distribution.
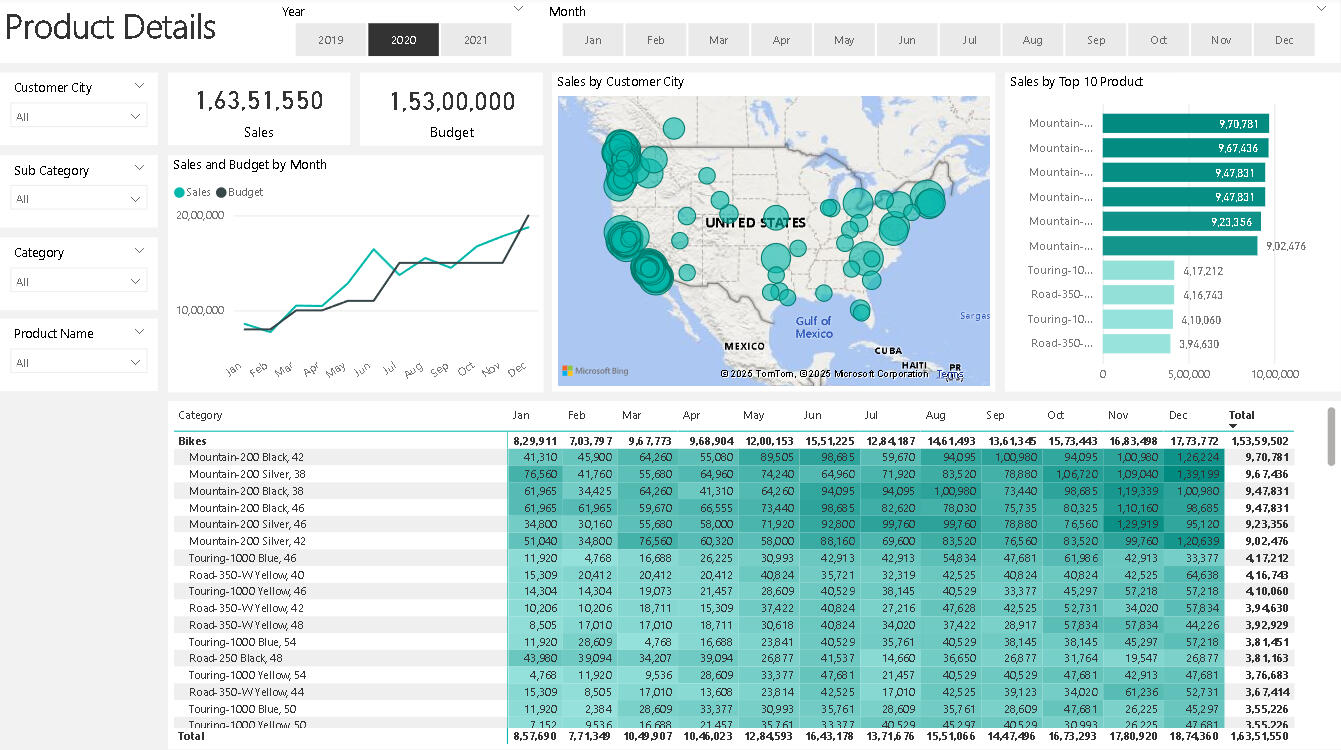
3. Product Details Dashboard: Provides detailed insights into product-specific sales and trends.Key Takeaways
• The Sales Overview Dashboard revealed that sales consistently exceeded budget during Q4, driven by holiday shopping.
• The Customer Details Dashboard highlighted that the top 10 customers accounted for 30% of total sales, indicating a high concentration of revenue among a small customer base.
• The Product Details Dashboard showed that certain product categories, like high-tech gadgets, outperformed others in terms of growth and profitability.These insights are just the beginning. Dive into the dashboard yourself to discover the hidden stories in your sales data. Who knows what other revelations await?
NYC Rideshare Analysis
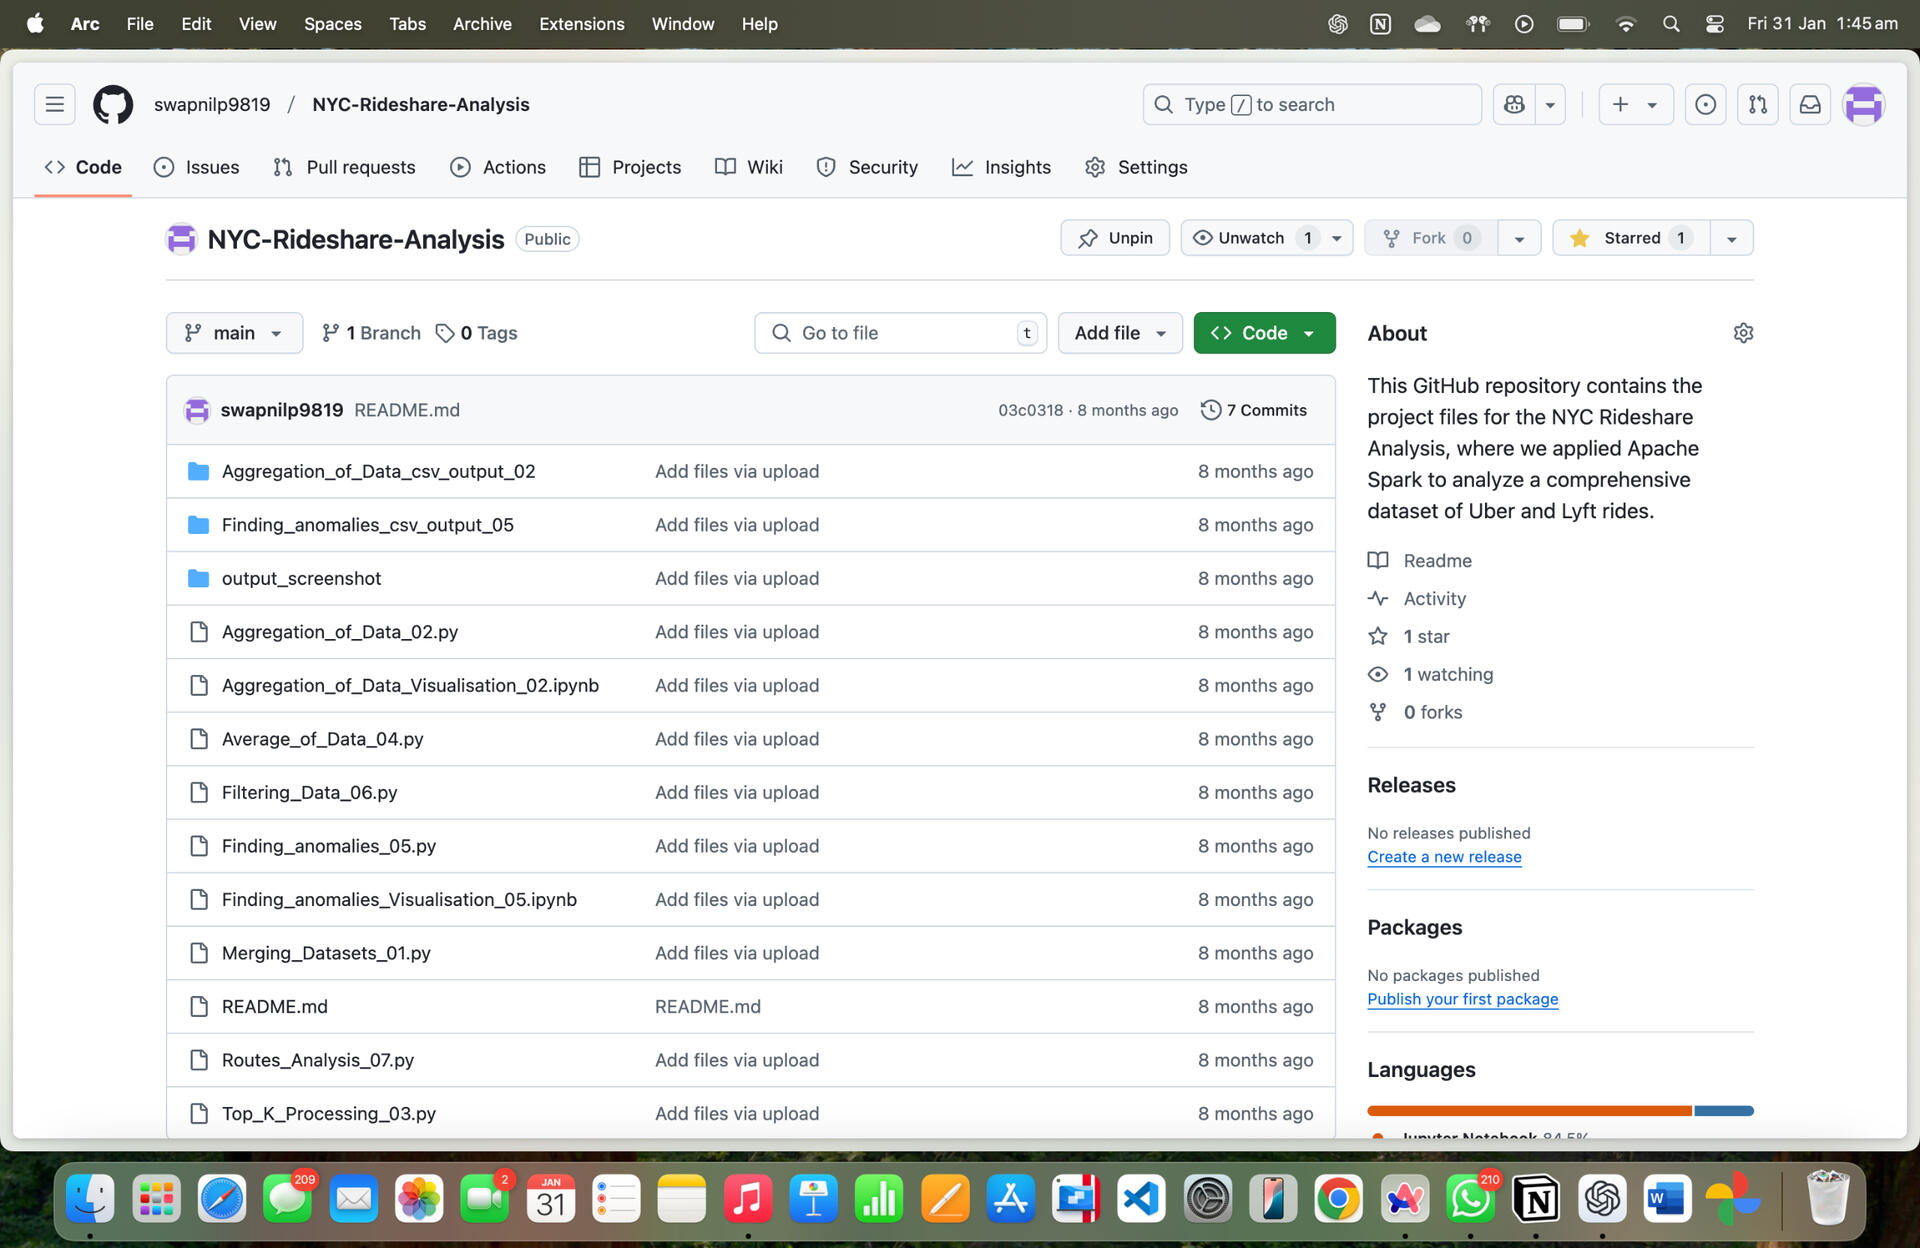
What drives the NYC rideshare industry? I analyzed millions of Uber & Lyft trips (Jan–May 2023) using Apache Spark to uncover high-demand routes, peak earnings hours, and wait-time anomalies. These insights can boost driver profits, enhance customer experience, and optimize operations.Here are the questions I was interested in answering:
• How does ride frequency change by borough and time?
• When are driver earnings highest during the day?
• What factors influence passenger wait times?
• Which routes have the most rides?
• Are there any unusual ride patterns or anomalies?I took the following steps to create my analysis:
• Loaded and cleaned rideshare data in Apache Spark.
• Merged trip records with taxi zone data for location insights.
• Used Spark SQL to compute trip counts, driver earnings, and profits.
• Applied Top-K analysis to find the busiest pickup/dropoff locations.
• Filtered data to analyze wait times and detect anomalies.
• Exported processed data to CSV for further visualizationHere are my key takeaways:
• Uber had more trips and higher profits than Lyft.
• Drivers earned most in afternoons and late nights.
• New Year’s Day had unusually long wait times.
• Brooklyn-Staten Island routes had unexpected high demand.
E-Commerce Customer Network Analysis
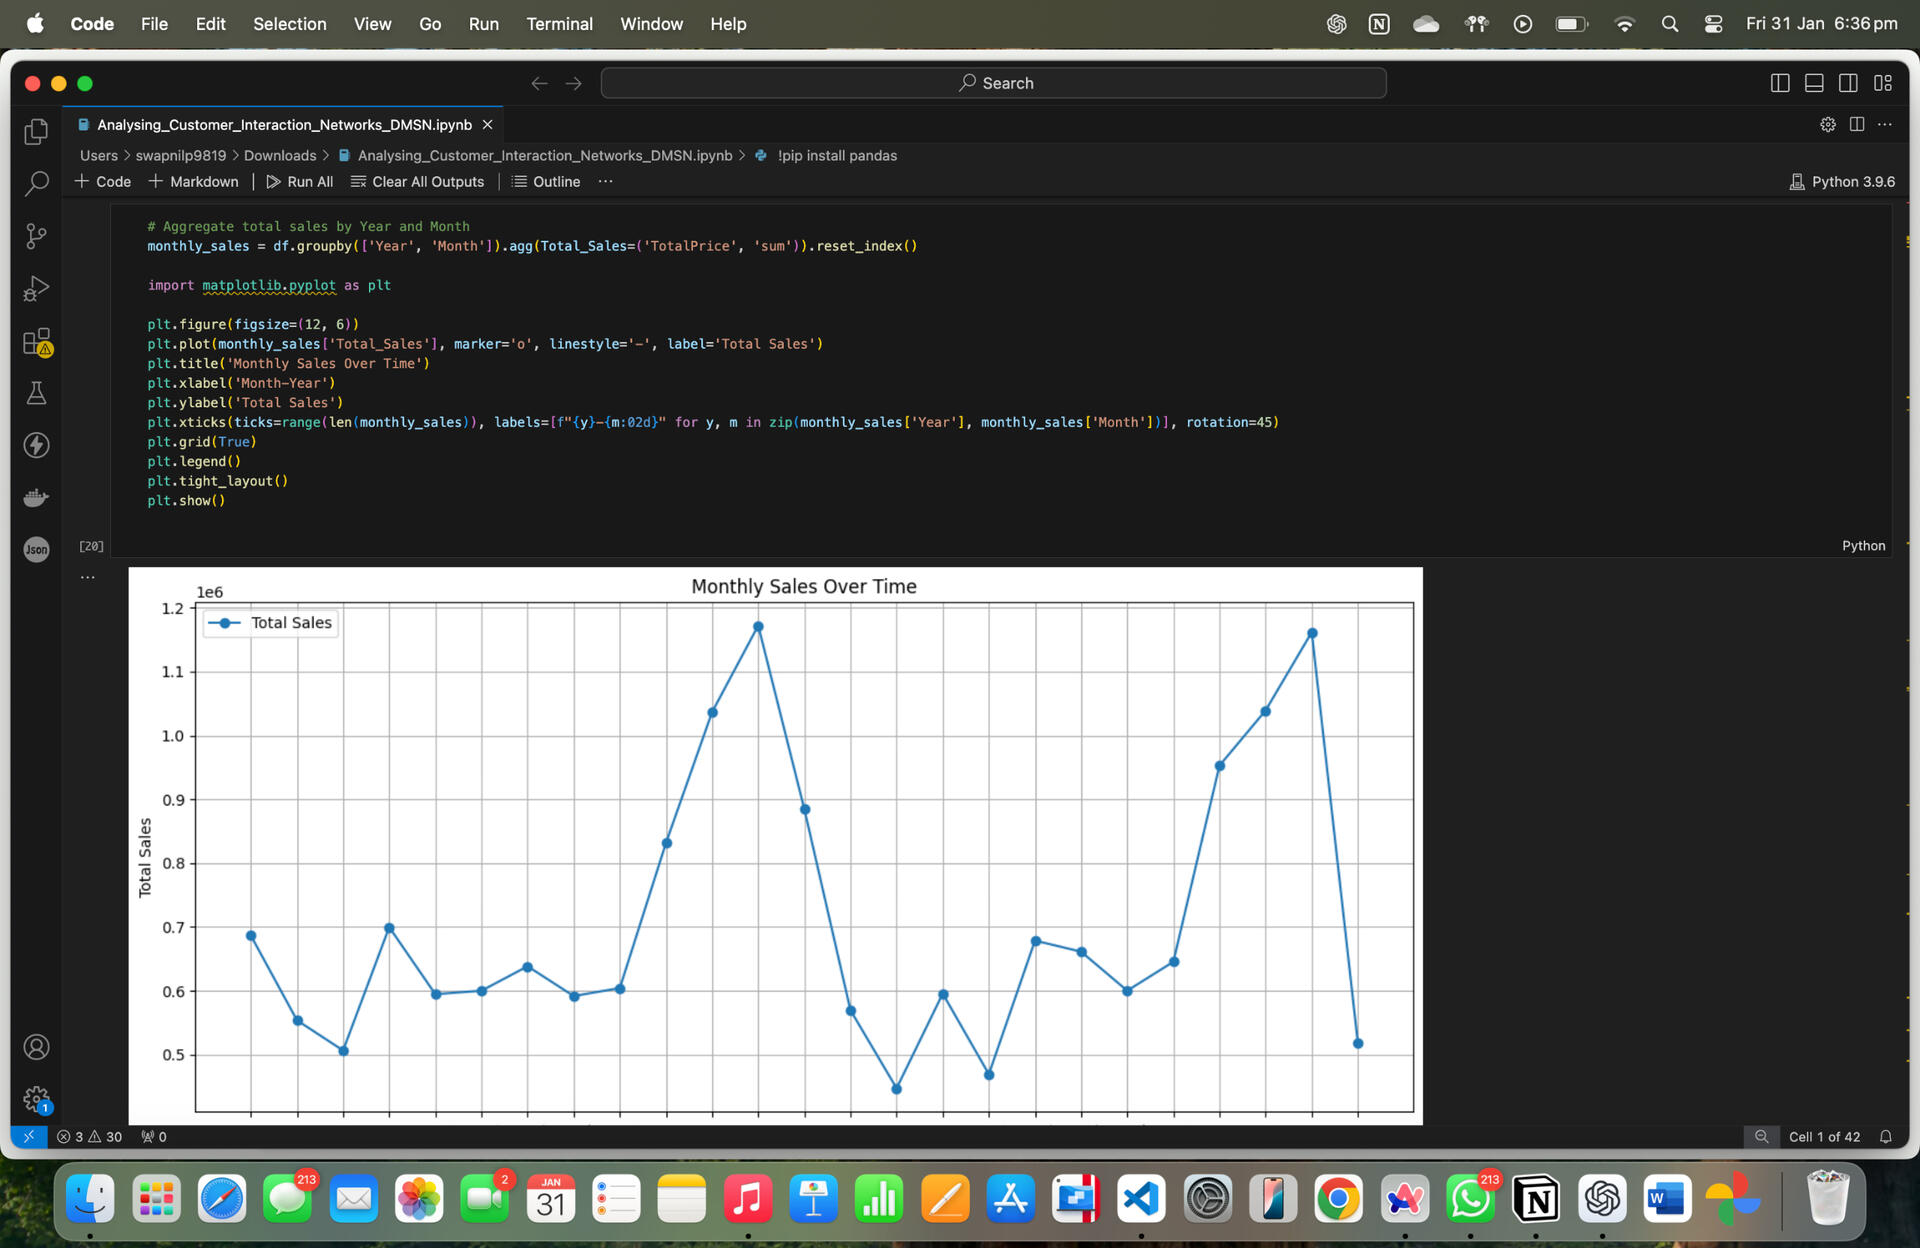
The Core Questions: What Did I Aim to Uncover?
• What are the distinct communities within customer-product networks?
Understanding how customers’ purchasing patterns form natural clusters based on shared preferences.
• How do customer and product relationships evolve over time?
Analyzing transaction data to identify seasonal trends and market shifts.
• How can network analysis techniques improve recommendation systems?
Exploring how tools like PageRank can personalise recommendations and drive sales by highlighting influential customers and products.
My Approach: How Did I Analyse the Data?
• Step 1: Data Preparation
I started with the “Online Retail II” dataset from UCI, which provided comprehensive details on customer-product transactions (including product IDs, quantities, prices, etc.).
• Step 2: Building the Network
By visualizing the bipartite network, I connected customers and products through their transactions, forming a dynamic map of relationships.
• Step 3: Community Detection
Using the Girvan-Newman algorithm, I identified groups of products and customers with shared characteristics. This helped spot market niches.
• Step 4: Temporal Analysis & Influence Mapping
I tracked how interactions changed over time, revealing seasonality and the influence of specific products and clients in the network.
• Step 5: Recommendation Systems
I compared traditional collaborative filtering with graph-based methods (e.g., PageRank), evaluating their performance in providing personalised and relevant recommendations.
Key Insights: What I Discovered from My Analysis
• Product and Customer Communities
Clear clusters emerged, with electronics and home décor leading, offering valuable insights for targeted marketing.
• Seasonality Matters
Seasonal spikes in transactions help optimize promotional timing and marketing efforts.
• PageRank vs. Collaborative Filtering
Combining both methods balances broad network influence with personalized recommendations for better accuracy.
Sentiment Analysis From Tweets
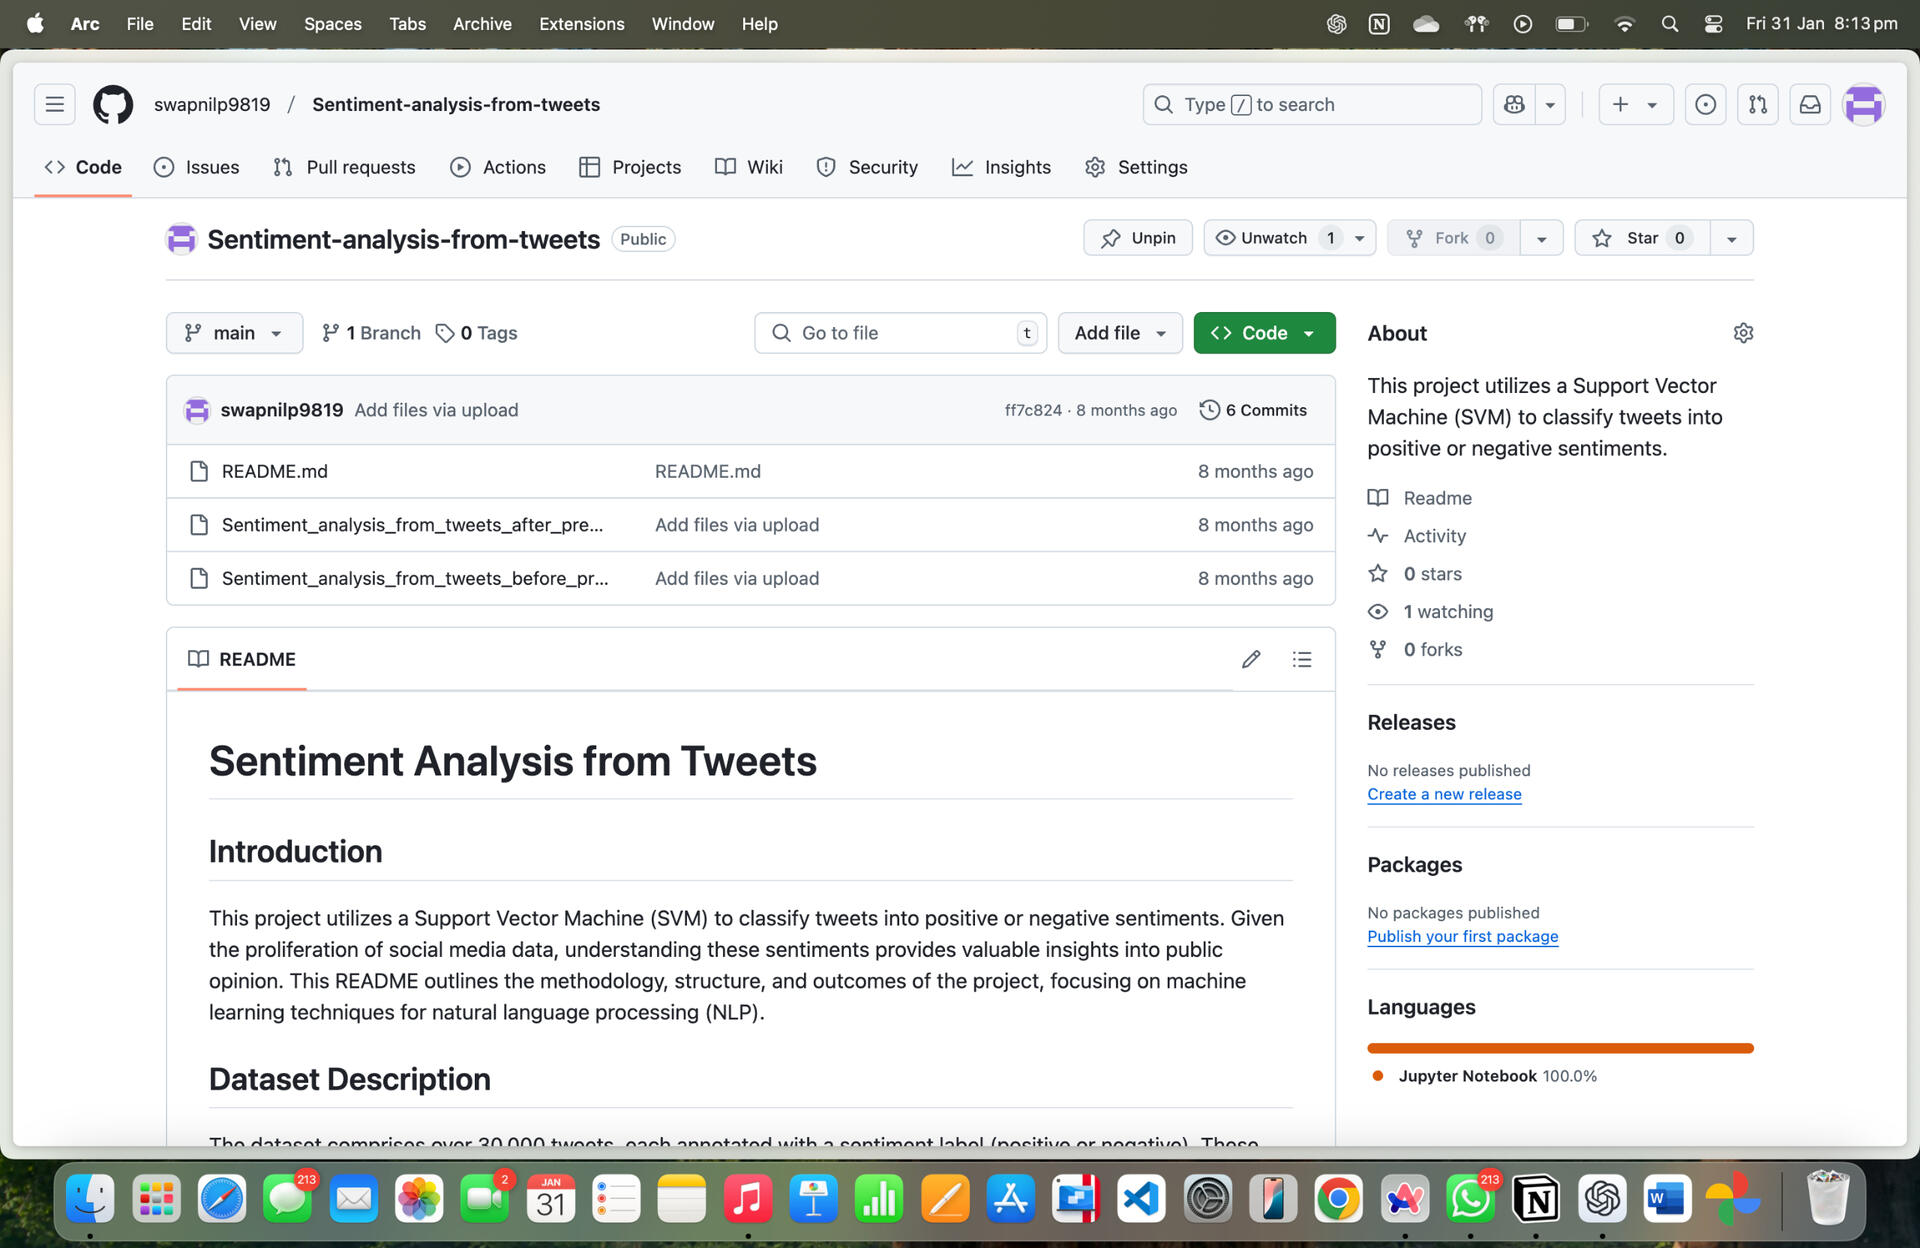
In this project, I leveraged Support Vector Machine (SVM) techniques to analyze the sentiment of over 30,000 tweets, categorizing them as positive or negative. The goal was to capture the pulse of public opinion from the vast sea of social media data, providing insights into societal trends and consumer sentiments.Key Stages of the Project:
• Data Preprocessing: Starting with basic tokenization and cleaning, I then progressively optimized the process by incorporating punctuation handling, lemmatization, and n-grams to enhance accuracy.
• Feature Extraction: Moving from a binary to frequency-based feature extraction method significantly improved the classifier’s performance by giving more weight to key sentiment-driving words.
• Model Optimization: Iterative testing and performance evaluations led to notable improvements in classification accuracy, precision, and recall.Key Takeaways:
• Preprocessing Matters: Simple changes like handling punctuation and using n-grams boosted the model’s ability to grasp the sentiment nuances in tweets.
• Accuracy Boost: Through enhancements, I increased the model’s accuracy from 83.04% to 86.67%, with improvements in precision, recall, and F1 score.
• Future Potential: Exploring deep learning models and integrating sentiment-specific word embeddings could push performance even further.Why This Project Matters:
Social media is an invaluable resource for gauging public opinion in real-time. This analysis not only demonstrates how machine learning techniques can be applied to NLP problems but also offers actionable insights that can benefit industries like marketing, politics, and customer feedback analysis.